Forecasting Demand
Forecasts depend upon what is to be done. They must be made for the strategic business plan (SBP), the production plan (PP) and the master production schedule (MPS). The purpose, planning horizons and level of detail vary for each.
The strategic business plan is concerned with overall markets and the direction of the economy over the next two to ten years or more. Its purpose is to provide time to plan for those things that take long to change. For production, the strategic business plan should provide sufficient time for resource planning: plant expansion, capital equipment purchase, and anything requiring a long lead time to purchase. The level of detail is not high, and usually forecasts are in sales units, sales dollars, or capacity. Forecasts and planning will probably be reviewed quarterly or yearly.
Production planning is concerned with manufacturing activity for the next one to three years. For manufacturing, it means forecasting those items needed for production planning, such as budgets, labor planning, long lead time, procurement items, and overall inventory levels. Forecasts are made for groups or families of products rather than specific end items. Forecasts and plans will probably be reviewed monthly.
Master production scheduling is concerned with production activity from the present to a few months ahead. Forecasts are made for individual items, as found on a master production schedule, individual item inventory levels, raw materials and component parts, labor planning, and so forth. Forecasts and plans will probably be reviewed weekly.
Demand patterns
A pattern is the general shape of a time series. Pattern shows that actual demand varies from period to period. If historical data for dem
and are plotted against a time scale, they will show any shapes or consistent patterns that exist. A pattern is the general shape of a time series.Although some individual data points will not fall exactly on the pattern, they tend to cluster around it. 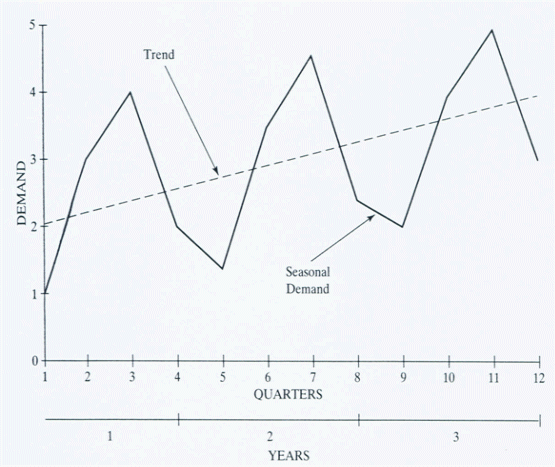
The above fig shows a hypothetical historical demand pattern. The pattern shows that actual demand varies from period to period. There are four reasons for this: trend, seasonality, random variation, and cycle.
- Trend: The trend can be level, having no change from period to period, or it can rise or fall;
In trend method a forecast is calculated by inserting a time value into the regression equation. The regression equation is determined from the time-serieas data using the “least squares method”.
F=a+bt
This graph illustrates a linear trend, but there are different shapes, such as geometric or exponential. The trend can be level, having no change from period to period, or it can rise or fall.
- Seasonality: Each year’ s demand fluctuating depending on the time of year;
The demand pattern in the figure shows each year’s demand fluctuating depending on the time of year. This fluctuation may be the result of the weather, holiday seasons, or particular events that take place on a seasonal basis. Seasonality is usually thought of as occurring on a yearly basis, but it can also occur on a weekly or even daily basis. A restaurant’s demand varies with the hour of the day, and supermarket sales vary with the day of the week
- Random variation: It occurs where many factors affect demand during specific periods and occur on a random basis;
Random variation occurs where many factors affect demand during specific periods and occur on a random basis. The variation may be small, with actual demand falling close to the pattern, or it may be large, with the points widely scattered. The pattern of variation can usually be measured, and this will be discussed in the section on tracking the forecast.
- Cycle: Over a span of several years, wavelike increases and decreases in the economy influence demand. Forecasting of cycles is a job for economists.
PRINCIPLES OF FORECASTING
Forecasts have 4 major characteristics:
- Forecasts are usually wrong,
- Every forecast should include an estimate of error,
- Forecasts are more accurate for families or groups,
- Forecasts are more accurate for nearer time periods.
Stable versus dynamic
The demand pattern that retain the same general shape are called stable and those that do not are called dynamic. Dynamic change can affect the trend, seasonality or randomness of the demand. The more stable the demand, the easier it is to forecast.
Dependent versus independent demand
A product is independent when is not related to the demand for any other product. Dependent demand for a product occurs where the demand for the item is derived from that of a second item. Requirements for dependent demand are calculated
and for independent demand need be forecast.