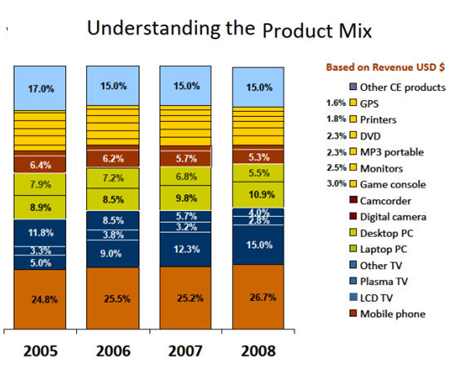
II. Master Planning of Resources

MPR is defined as a grouping of the business processes which includes the following activities

Demand Management : http://www.apicsforum.com/ebook/7._demand_management
SOP : http://www.apicsforum.com/ebook/2._production_planning
Master Scheduling : http://www.apicsforum.com/wiki/3._master_production_schedule

Planning Process:

The planning process involves a balancing act between demand (sales forecasts & actual customer orders) & supply (production & purchase orders). If demand exceeds supply then a shortage will occur & if the demand is less than supply then excess inventory will be created.
Two of the most important issues from the supply perspective are product volume & product mix.

i.  Product Volume:
The level of product volume establishes the big picture of demand placed on a supply operation. Product volume is generally expressed in rates of demand at the product group level.
It is generally difficult for a supply operation to change the supply rate from period to period. Supply operations prefer level loading in terms of product volume.

ii. Product Mix:
As per the 11th ed of APICS dictionary “The proportion of individual products that make up the total production or sales volume”.
It is measure of the different types of the product that can be supplied within a particular product group.

 Mix variation is typically a problem for supply operations that have inflexible processes. Any operation with significant capital investment in high speed machinery that requires long production runs to justify the high cost of setting up the equipment requires a product mix. E.g. steel mills & paper making operations. Product mix determines the specific amounts of each product type to be produced to meet the needs of the overall plan. Variation in the product mix can be handled with relative ease by reducing set up time & the adoption of small work cells.

Planning Horizon:
As per APICS dictionary “planning horizon is the amount of time a plan extends into the future”. For a master schedule, this is normally set to cover a minimum of cumulative lead time plus time for lot sizing low-level components and for capacity changes of primary work centers or of key suppliers. For longer term plans the planning horizon must be long enough to permit any needed additions to capacity.

Strategic Business Plan

As per APICS dictionary “it is a statement of long-range strategy and revenue, cost, and profit objectives usually accompanied by budgets, a projected balance sheet, and a cash flow (source and application of funds) statement”.

A business plan is usually stated in terms of dollars and grouped by product family. The business plan is then translated into synchronized tactical functional plans through the production planning process (or the sales and operations planning process). Although frequently stated in different terms (dollars versus units), these tactical plans should agree with each other and with the business plan. It’s a document consisting of the business details (organization, strategy, and financing tactics) prepared by an entrepreneur to plan for a new business.

The business plan sets the overall activities for the business & addresses specific issues & concerns that typically relate to:
a) The nature of the firm which includes type of business, nature of the enterprise.
b) The locations & facilities of the enterprise, such as the use of the global supply chains, strategic alliances with partners, production facilities & distribution channels.
c) The type of organization & the skills of the people required.
d) Levels of processing technology, such as the processing of material resources into components, the assembly of components into finished products & the distribution of products to a customer.
e) The type & nature of capital resources required, such as short term bridging loans, long term debt financing & venture capital or market capitalization from & initial purchase offering.
f) The interest of primary stakeholders, such as members of an association, customers of a commercial enterprise, suppliers to a corporation, donors to a political organization, community groups to a government body & associates in retail organization.


The Market Definition in business plan should include:
a) The location of customers & the nature of their relationship with the supplying organization i.e. is the customer a direct customer, an indirect customer, a consumer of a product or service, or an influencer of a potential consumer.
b) Information about projected market growth rates & demographic information about future customers.
c) Impact of social changes including changing needs of customers.
d) Global & regional economic considerations & business conditions as they affect customer needs

The business environment definition should include:
a) Information about current & future potential competitors, including benchmarked information wherever possible.
b) Projections of business growth, including environmental threats & opportunities.
c) Information on the availability of financial resources & sources of funding required.
d) Information on potential & emerging technologies & their impact on business performance.

Key Business Goals:
a) Projected business growth.
b) Targeted profitability.
c) Anticipated return on investment.
d) Desired market share.
e) Shareholder value.
f) Company Value.
g) Customer Service.

Business Stakeholders: Business stakeholders include all those groups affected by the operations of the organization like the community, the management team, the business owners and shareholders, the members of an association, the workers, the customers & the suppliers of the organization. All these business stakeholders must be considered in the development of the
business plan.

Benchmarking: As per the APICS dictionary “It is the process of measuring the company’s products, services, costs, and practices”. Two types of benchmarking exist—competitive, a comparison against your industry best, and process, a comparison of a process to the best-inclass. During the development of the business plan may aspects of operational performance must
be compared with the performance of other organizations. Benchmarking can be done in many ways but these normally include reciprocal site visits & mutual exchange of specific information bet’n 2 organizations. It is recommended to compare an organization’s performance with others that have clearly demonstrated that they are the best in class for that particular process.

Strategic Data Sources for Business Plan:
a) Many companies deploy a process called environmental scanning that basically provides input from the marketplace about trends occurring within global communities where the organization is operating or seeking to penetrate. It provides information about demographics, likely changes in regulation, market growth potential, general economic conditions, current market players, potential competitors, current customer preferences & satisfaction levels with current suppliers & more.

b) Also an organization needs to review it’s current capabilities such as the skills of the workforce, the core competencies of the organization, that available resources & the application of information technology for competitive advantage.

c) Financial targets that are set by the executive team which includes projected earning levels, business growth, market penetration, cash flow generation, ROI targets & product volume targets.

d) Strategic goals set by executive team which includes desired levels of customer service, planned quality improvements, cost reduction goals, lead time reduction & productivity improvements.

Forecast Decissions

Leading Indicators:
There are several types of forecasts that are based on external indicators factors that determine the demand performance of a related item. E.g. the demand for new housing will have direct impact on the demand for the constriction materials, interior furnishings & appliance purchases. A causal factor is a factor that creates demand for a specific product.

A good example of the use of causal factors in forecasting is the development of a forecast for a crop pesticide based on causal factors. Published information defines the number of acres of a particular crop. That will be planned next season. The company then estimates the amount of corps that will be treated with pesticide. They then estimate their share of the market & determine the amount of pesticide normally used per acre.

New Product Introduction:
The challenge for a new product is to forecast demand for a product that has never been sold before. An example of the need for this kind of forecast is the area of ‘”provisioning” of aircraft spare parts. The question arises as how many spare parts to carry in each regional maintenance center to support the fleet in active service with a minimum of aircraft downtime. Before the regional jet had completed it’s flight testing, decisions had to be made about the initial & replenishment stocking levels for all spare & service parts for the entire aircraft fleet. Forecasts were made on the likely number of flight hours before various spare parts would need to be replaced.

A preventive maintenance schedule was developed based on predicted mean time between failure statistics that had been estimated by design engineering. Stocking levels were then established using safety stocks based on the potential error in the forecast. As soon as the aircraft entered active service, actual data were used to replace estimates & stocking levels were adjusted.

Some companies are introducing products that are in the same family as is a previous product, or replacement products & they can use historical analogy as a good indicator of future sales. The impact of introducing new product on the existing sales is important. When the customer is provided with choices he may buy the new model & sales. Historical analogy allows a company to minimise & manage the risk associated with the new product introduction.

Focus Forecasting:
Focus forecasting is “a system that allows the user to simulate the effectiveness of numerous forecasting techniques, enabling selection of the most effective one”. It was invented by Bernard Smith when he was working for Servistar in 1972. He was responsible for forecasting 20000 independent demand items, nuts, bolts, screws & fasteners. Focus forecasting is computer based simulation technique that compares the forecasts generated using any of 14 simple strategies.

The computer selects the best strategy to forecast this item at this moment in time. It does this through a process of simulation. The computer goes back through 3 periods at a time & pretends they did not happen & then projects the 3 periods using each of the simple strategies. Whichever strategy gives best fit to the actual results becomes the strategy selected to forecast this item at this point in time. The simulation can result in different strategies being applied to an item every period.

Following are the assumptions of focus forecasting:
a) The most recent past is the best indicator of the future.
b) One forecasting model is better than others.
c) All forecasting models will be compared for all items forecasted.
d) Recent history will be forecasted for each item with each model.
e) The model which achieves the closest fit to actual product sales will be selected.
f) This model will be used to forecast this item this time.
Focus forecasting still used in Servistar, which forecasts 2,50,000 SKUs every month.

Data Issues for forecasting:
The accuracy of the forecast depends upon the following factors which are involved in data collection:
a) Availability of data: It is the access to historical information concerning the level of sales activity for a certain item. It is important to preserve the sales history when new systems are implemented.
b) Consistency of data: the data collected should be comparable from period to period. It is critical that the data are captured in the same terms. E.g. the item nos. should be the same over the entire period from which the sales information is being collected.
c) Amount of history: A product that is subject to seasonal demand at least to seasons of demand are required to establish the amount of seasonal activity.
d) Forecast frequency: It is the periodic interval bet’n the successive generation of the forecast. Mostly it is a month.
e) Cost & Time Issues: It refers to the cost associated with the generation of the forecast. There is an inherent cost associated with the acquisition, storage & processing of forecast information. This cost must be compared with the value of the forecast. There is also a time factor associated with a larger database; it takes more processing time to get results. The forecasting system needs to perform within prespecified cost & time standards.
f) Recording true demand: it is actual demand that is recorded for a product or service as opposed to the dates on which the company can support the customer’s request. True demand occurs at the level of the ultimate customer-the consumer or end user of the product or service.
g) Order date vs. ship date: When there is a significant lead time from requirement to delivery this information becomes very critical. The organization needs to develop 2 forecasts one at the level of order input received (a bookings forecast) & the other at the level of anticipated shipment (shipment forecast). This information also relates to the quantity ordered vs. the quantity shipped.
h) Product Unit vs. Financial Units: Sales & operations do not speak the same language.
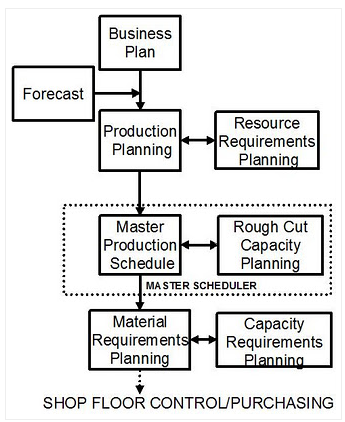
i) Level of aggregation: It refers to the use of different forecasts & data at different levels within the organization. The level of overall business activity is expressed in the business plan, groups of products are expressed in the SOP & detailed schedules are expressed as specific units.
j) Custom Partnering: It improves communications thereby increasing accuracy of forecast. When the customers & the suppliers are partners the information is shared.

Planning Horizons & Time Periods:
a) Calendar: Mostly the future sales are forecasted by a month. If the sales forecasts by calendar month & operation forecasts by the number manufacturing days in a given month or quarter. In view of the possible variations, the need to establish an agreed upon company calendar for consistency & communication purpose is apparent.
b) Time periods & planning intervals: Common alternatives are days, weeks, months, quarters or years. The planning cycle refers to the frequency of revision to the plans are developed. Business plan is developed on an annual basis, a SOP on a monthly basis & a master production schedule on a
weekly or daily basis.
c) Planning Horizons: It is the length of time into the future for which the forecast will be generated. The planning horizon is equal to the length of the period multiplied by the number of periods. As a general rule the further into the future that the forecast is made, the less accurate the forecast will be. The forecast should cover a sufficient time for the specified planning purpose.

Data Preparation & collection:
The accuracy of source data is fundamental to the generation of sales forecasts. Collection & recording of the data is the most important aspect. The data should be collected in the same term as the forecast requires. If the forecast is expressed in weekly intervals then the data should be collected in weekly intervals.

It is important to record customer requested quantities not merely shipments since shipments are constrained by product or resource availability. Shipments may not reflect the true level of sales that were available to the company. The shipments are the measure of supply not demand.

Additionally the sales numbers do not include lost sales-sales that would have been realized if the product or service had been available at the time of customer need. It is important to estimate the level of lost sales to create a true forecast of potential sales that can be generated.

It is also important to track the original customer requested date vs. promised date. In a service organization lost sales may not be recorded. The customer can cancel the order or look for the alternative if he is dissatisfied with the service.
Forecast can be generated at many levels but will be more accurate at higher levels than at lower levels. Forecasts can be aggregated up the pyramid from the detail level to the aggregate level.

Dealing with Outliers:
“A data point that differs significantly from other data for a similar phenomenon. For example, if the average sales for a product were 10 units per month, and one month the product had sales of 500 units, this sales point might be considered an outlier”. Some forecasting system permits users to remove outliers from the data. In some cases the outliers may be a singular anomaly (a one time event) unlikely to be repeated at any time in the future. Regardless of whether or not this information is used for forecasting or sales projections including the outlier will distort the demand. The outlier may be caused by the events that have a probability of recurrence. It is always easier to remove the problem outlier than to
adjust the forecast model that may need to be changed.

Decomposition of data:
Decomposition is “a method of forecasting where time series data are separated into up to three components: trend, seasonal, and cyclical; where trend includes the general horizontal upward or downward movement over time; seasonal includes a recurring demand pattern such as day of the week, weekly, monthly, or quarterly; and cyclical includes any repeating, non seasonal pattern. A fourth component is random, that is, data with no pattern. The new forecast is made by projecting the patterns individually determined and then combining them”. Steps in decomposition are:
1. Purify the data,
2. Adjust the data,
3. Take out the baseline & components,
4. Identify demand components,
5. Measure the random error,
6. Project the series,
7. Recompose.

Validating the Plan & Measuring Performance


In business it is important to create a balanced approach to performance measurement. In many organizations financial measurements are considered to be the most important. The problem with focusing exclusively on financial measurements is that these tend to be historical & are not necessarily good indicators of the future performance. It is critical for continued business success that a balanced approach to performance measurement be adopted. This should consider all aspects of business performance including customer service, operational improvement, employee satisfaction etc. This process of performance measurement has been called the balanced scorecard.

“a list of financial and operational measurements used to evaluate organizational or supply chain performance. The dimensions of the balanced scorecard might include customer perspective, business process perspective, financial perspective, and innovation and learning perspectives. It formally connects overall objectives, strategies, and measurements. Each dimension has goals and measurements”.

Then what exactly is a Balanced Scorecard? A definition often quoted is: 'A strategic planning and management system used to align business activities to the vision statement of an organization'. More cynically, and in some cases realistically, a Balanced Scorecard attempts to translate the sometimes vague, pious hopes of a company's vision/mission statement into the practicalities of managing the business better at every level.

A Balanced Scorecard approach is to take a holistic view of an organization and co-ordinate MDIs so that efficiencies are experienced by all departments and in a joined-up fashion. 
To embark on the Balanced Scorecard path an organization first must know (and understand) the following:

The company's mission statement
The company's strategic plan/vision

Then

The financial status of the organization
How the organization is currently structured and operating
The level of expertise of their employees
Customer satisfaction level


The balanced scorecard has evolved from its early use as a simple performance measurement framework to a full strategic planning and management system. The “new” balanced scorecard transforms an organization’s strategic plan from an attractive but passive document into the "marching orders" for the organization on a daily basis. It provides a framework that not only provides performance measurements, but helps planners identify what should be done and measured. It enables executives to truly execute their strategies.

This new approach to strategic management was first detailed in a series of articles and books by Drs. Kaplan and Norton. Recognizing some of the weaknesses and vagueness of previous management approaches, the balanced scorecard approach provides a clear prescription as to what companies should measure in order to 'balance' the financial perspective. The balanced scorecard is a management system (not only a measurement system) that enables organizations to clarify their vision and strategy and translate them into action. It provides feedback around both the internal business processes and external outcomes in order to continuously improve strategic performance and results. When fully deployed, the balanced scorecard transforms strategic planning from an academic exercise into the nerve center of an enterprise.

Perspectives
The balanced scorecard suggests that we view the organization from four perspectives, and to develop metrics, collect data and analyze it relative to each of these perspectives:

The Learning & Growth Perspective
This perspective includes employee training and corporate cultural attitudes related to both individual and corporate self-improvement. In a knowledge-worker organization, people -- the only repository of knowledge -- are the main resource. In the current climate of rapid technological change, it is becoming necessary for knowledge workers to be in a continuous learning mode. Metrics can be put into place to guide managers in focusing training funds where they can help the most. In any case, learning and growth constitute the essential foundation for success of any knowledge-worker organization.

Kaplan and Norton emphasize that 'learning' is more than 'training'; it also includes things like mentors and tutors within the organization, as well as that ease of communication among workers that allows them to readily get help on a problem when it is needed. It also includes technological tools; what the Baldrige criteria call "high performance work systems."

The Business Process Perspective
This perspective refers to internal business processes. Metrics based on this perspective allow the managers to know how well their business is running, and whether its products and services conform to customer requirements (the mission). These metrics have to be carefully designed by those who know these processes most intimately; with our unique missions these are not something that can be developed by outside consultants.

The Customer Perspective
Recent management philosophy has shown an increasing realization of the importance of customer focus and customer satisfaction in any business. These are leading indicators: if customers are not satisfied, they will eventually find other suppliers that will meet their needs. Poor performance from this perspective is thus a leading indicator of future decline, even though the current financial picture may look good.

In developing metrics for satisfaction, customers should be analyzed in terms of kinds of customers and the kinds of processes for which we are providing a product or service to those customer groups.

The Financial Perspective
Kaplan and Norton do not disregard the traditional need for financial data. Timely and accurate funding data will always be a priority, and managers will do whatever necessary to provide it. In fact, often there is more than enough handling and processing of financial data. With the implementation of a corporate database, it is hoped that more of the processing can be centralized and automated. But the point is that the current emphasis on financials leads to the "unbalanced" situation with regard to other perspectives.  There is perhaps a need to include additional financial-related data, such as risk assessment and cost-benefit data, in this category.

Strategy Mapping
Strategy maps are communication tools used to tell a story of how value is created for the organization.  They show a logical, step-by-step connection between strategic objectives (shown as ovals on the map) in the form of a cause-and-effect chain.  Generally speaking, improving performance in the objectives found in the Learning & Growth perspective (the bottom row) enables the organization to improve its Internal Process perspective Objectives (the next row up), which in turn enables the organization to create desirable results in the Customer and Financial perspectives (the top two rows).

Measuring Sales & Operations plan


Reviewing key performance indicators is an important part of any working S&OP process. Experience suggests a set of standardized measurements (sometimes called key performance indicators-KPI’s or vital signs) that should be published during the process, and reviewed at the meetings that make up the process. Some performance indicators will be reviewed in the early steps of the S&OP process, but not at the executive meeting. The critical metrics will be reviewed in the executive meeting.

Vital signs reviewed during the S&OP process:
Measure whether the needs of customers are being met (on-time and in-full).
Measure whether the financial objectives of the business as defined by the business plan are being met.
Identify problems and then assist in prioritizing problems so they can be solved.
Provide a scorecard for monitoring improvement.

The sales & operations plan is validated by resource planning process. Resource planning is concerned with identifying the load placed on all potentially constraining resources over the medium to long term time frame. This load is compared to the existing capacity capabilities & a judgment is made as to whether those capabilities are going to be sufficient for this future anticipated load. The process is iterative in nature & may be repeated many times before the sales & operations plan is finalized

Reviewing Historical performance:
The sales and operations planning system should include capabilities to capture and report the following:
1. Customer service performance by family and overall
Customer delivery performance (on-time and in-full – OTIF) to request date
Customer delivery performance (on-time and in-full) to promised date

2. Performance to budget (dollars) by family and overall
Latest sales plan vs. budget dollars
Profit projections for year
Inventory versus budget dollars

3. Performance to plan (units) by family
Actual shipments versus plan typically expressed as percentage attainment.
Actual sales versus forecast (some measurement of accuracy or variability) typically expressed as attainment, percentage error, or mean absolute percentage
error.
Actual supply versus supply plan expressed as percentage attainment, or percent variability from plan.
Actual inventory versus inventory plan (make-to-stock products) expressed as a percentage.
Actual backlog versus backlog plan (make-to-order products) expressed as a percentage.

The way these are actually reported will vary from company to company. In nearly every company, the “performance to plan” metrics will be reviewed as part of the family by family review, so summarizing them to a scorecard is somewhat redundant. For example, Below figure shows common performance
to plan metrics displayed as part of the S&OP display itself. Metrics on this make-to-stock example show actual sales to budget, actual sales to plan, actual production to plan, and actual inventory to plan expressed as a percentage of the budget or plan for the period.


Identify the causes for variation from the plan:
Determine the root cause of any variance to the plan. The investigation should determine if the cause is
likely to continue or if it can be rectified within a short time frame. If the cause can’t be rectified then the
future plan will have to be adjusted for the projected trend from the historical performance.

Target Inventories & backlog:
Review of current & future targets for inventory &/or backlog levels.
These targets should be reviewed in terms of actual performance & revised where necessary by the management team.

Consistency to previous Sales & Operations Plan:
Determine of the new plans are consistent with the previous sales & operations plan.
The output of the SOP process is an agreed upon plan for operations called the production plan.

Measuring Sales Performance:
Sales can be measured on the basis of the following factors:

Market Share is a measure of total market penetration.

Customer Share is measure of how many potential customers are attracted to a brand. It is a measure
of the recognition of the brand in the market place & the predisposition of the customer to buy the
brand when presented with a choice pf competing brands.

Customer Retention is a measure of the loyalty of customers to the provider of products & services.
Customer acquisition is a rate at which the new customers are signed up.

Product Acceptance is a measure of the way in which a market reacts to a particular product or
service. The higher the degree of acceptance the more likely the product or service will be continued
demand in the future.

Service Contracts are used to provide additional support to the customer after the sale.’
Customer Satisfaction is a measure of the overall perception f a customer with the supplier of a
product or service.

Customer Complaints is a measure of the dissatisfaction of the customer with a supplier of a product
or service.

Product returns is another measure of customer dissatisfaction.

Warranty claims are another measure of customer dissatisfaction

Monthly SOP Process

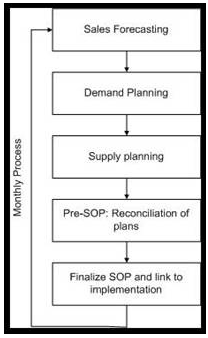
A Sales and Operations Planning process normally includes a series of meetings, finishing with a board level meeting at which, key long term decisions are taken, and the current progress against the Business Plan is reviewed.  The review has to cover at least 15 months.

The inputs to the SOP are forecast values and/or requirements from customer order management, sales information system, and controlling.

The main purpose of SOP is to establish production rates that will achieve management’s objective of maintaining, raising, or lowering inventories or backlogs, in order to keep the workforce relatively stable. This plan helps in planning the labor, equipment, facilities, material, and finances required to accomplish the production plan. This plan can be formed with information from marketing, manufacturing, engineering, finance, materials and so on.

Sales and operations planning can also be described as, "a set of decision-making processes to balance demand and supply, to integrate financial planning and operational planning, and to link high level strategic plans with day-to-day operations”.

SOP is the result of monthly planning activities and is usually based on an Annual Operations Plan (AOP). Therefore, the SOP is a main factor to gradually accomplish the AOP targets, by linking monthly sales and marketing planning directly to the operations side of a business.
 

Run Sales Forecast Reports:
Occurs in IT department shortly after the end of the month. It consists of:
Updating the files with data from the month just ended, actual sales, inventories, production, backlog etc.
Generating information for sales & marketing representatives to use in developing the new demand forecast.
Disseminating the information to the appropriate people.

The Demand Planning Phase:
Sales & marketing staff review the information received from step 1, analyse & discuss it & then generate the new management forecast over the planning horizon. The forecast must include all existing products & any product life cycle phase changes that are planned for in time frame covered by the planning horizon.

The Supply Planning Phase:
Representatives from the operations review the output from step 2, the revised demand forecasts over the planning horizon. All existing operations plans are reviewed to see which ones need to be changed from the previous plan. The o/p from the revised supply planning phase are operations plans that must be validated against the availability of existing supply resources using resource planning. 

The pre Sales & Operations Plan Meeting:
The objectives of this phase are:

  • Make decisions regarding the balancing of supply & demand.
  • Resolve problems& differences, so that a single set of recommendations can be brought to the executive SOP meeting.
  • Identify those areas where agreement can’t be reached & determine how the situation & supporting data will be presented in the executive SOP meeting.
  • Develop scenarios showing the impact of alternate courses of action to solve a given problem.

Several people from demand planning, a representative from product development, a representative from finance, several people from operations & the SOP process owner are involved in this phase. Family by family review of the demand & supply plans are done & adjustments were made where necessary & appropriate. This review should focus on actual vs. planned performance in demand & supply & the impact regarding to inventory or backlog plans.
The output from the presales & operations plan meeting includes:

  • An updated financial plan.
  • Recommended action for each product family.
  • New product introduction plans.
  • Recommendations for changes in resource plans.
  • Areas where agreement could not be reached with alternative scenarios & impact analysis.
  • Recommended changes to demand & supply strategies.
  • The agenda for executive SOP meeting.

The Executive SOP Meeting:
The objectives are:

  • To make decisions on each product family, to accept the recommendations from the pre SOP team or to determine alternative courses of action.
  • To authorize changes to the production or procurement rates, where major changes are foreseen.
  • To compare the sales & operations plans to the business plan in both product units & financial units & where there are discrepancies to make adjustments as required.
  • To make decisions where there was no agreement from the pre SOP team based on further analysis & information.
  • To review key business performance indicators & follow up on areas where performance is less than plan.

The O/Ps from the executive SOP meeting are the meeting minutes. A summary of decisions taken, a summarised action plan with due dates & responsibilities & the authorized company game plan, the complete sales & operations plan for each product family.

The SOP process is an iterative closed loop process, starting with the development of a preliminary plan based on balancing supply & demand information. The out puts of the SOP process are:

  • The production plan.
  • The purchase plan.
  • The inventory plan (for MTS product group).
  • The backlog plan (for MTO product groups).

The approved sales & operations plan provides the framework for the master scheduler to develop specific master schedules for items within each product group. The sales & operations plan limits the aggregate rate of production to the level stated for each product group for each planning period.


Input Outpts SOP

Input to SOP:

  • Statement of projected demand (marketing): this is a sales plan based on the most up to date information available from the market place.
  • Market Intelligence (marketing): Information about potential external factors that could have an impact on product or service demand from the market place.
  • Actual Sales & Booked Orders (sales): Updated information from customers regarding existing orders that have been placed.
  • Management Targets (management): These are performance targets that have been established in areas that are critical to the success of the business.
  • Indication of capabilities & capacities (manufacturing or purchasing): Information about potential capacity constraints of resources that should be considered over the planning horizon.
  • Estimation of Financial Resources Required (finance): a plan for the amt of funding reqd. to support the level of demand & supply activity over the course of the planning horizon.
  • New Product Information (Product development): Information abt. new products or product changes that will be introduced during the period covered by the sales & operations plan.
  • New Process Information (process Engineering): Information abt. new processes or process changes that will be introduced during the period covered by the sales & operations plan.

Out Puts from SOP Process:

  • Sales Plan (marketing & sales): The approved demand plan for the period covered by the sales & operations plan.
  • Production Plan (manufacturing): The approved production plan for the period covered by the sales & operations plan.
  • Inventory Plan (materials): The approved inventory plan for the period covered by the sales & operations plan.
  • Backlog Projection (Customer Service): The approved backlog plan for the period covered by the sales & operations plan.
  • Purchasing Plan (Purchasing): The approved purchasing plan for the period covered by the sales & operations plan.
  • Financial Plan (Finance): The approved finance plan for the period covered by the sales & operations plan.
  • Engineering Plan (engineering): The approved product & process plan for the period covered by the sales & operations plan.

Simulation:

Simulation is an integral part of developing a realistic analytical model. Simulation enables the planning team to create a model with different types of cost relationships. Computation & evaluation of costs are possible. Costs that may change at specific points in the production process can also be played out using simulation. It can approximate reality more closely than any other analytical methods in many situations.
Running a simulation model does not guarantee an optimum solution but it does allow team members to come close to an optimum solution & it promises a realistic view of production options.