Production Plan III
SOP Process
SOP is not a scheduling tool! It is not an inventory replenishment tool! It is, however, a top level planning technique to provide overall rates of sales and production, and backlog and finished goods inventory positions. In a cellular or flow-line based operation, SOP provides the daily run rates for these product families.
SOP is the key business process that derives from the strategic plan, and from which scheduling, order promising, material, shop floor control, and many other processes derive
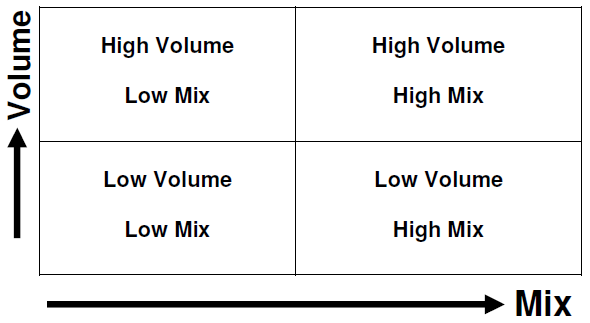
Where do you as a company fall into this chart? To run a business well, demand and supply must be in balance at both the volume and mix level. In reality this balance does not exist. Thus management must step up to understand this relationship. SOP is a set of tools to balance demand and supply. SOP operates at the volume level; it deals with rates of sales and production, and aggregate inventories and backlog.
Then how does the mix come into play? The Master Scheduler’s task is to balance demand and supply at the mix level. It’s concern with which individual products to run first, second, third and which customer orders will ship when.
These words are saying that SOP and Master Scheduling are not the same thing.
They’re different tools for different purposes.
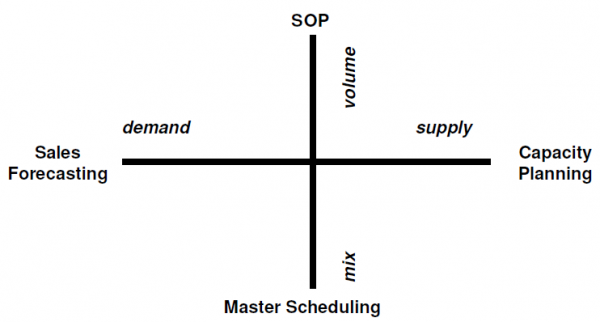
Now we must come to the two more fundamentals of the SOP process and that is demand and supply. How are they represented in the SOP process? Demand is represented by the Sales Forecast. Capacity Planning represents Supply. These tie in with mix and volume to give us the four components of SOP. Their relationship looks like the following chart:
Thus SOP is a monthly formal balancing of supply and demand through a six to twelve month planning horizon by aggregate product families. It generally includes incoming orders (bookings), backlog, shipments, forecast, finished goods inventory production and capacity projections is a monthly time buckets. It is conducted in a very prescribed format by the top management team. This is a critical point: Top Management. Any company, which embraces this process, must engage the general manager and direct reports. Otherwise, there will be a disconnect between there wishes and the information on the formal SOP document.
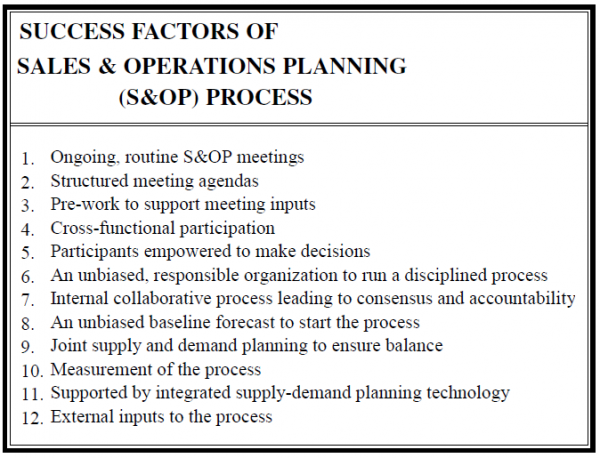
In below figure there is a list of a dozen factors that can help lead to operating an S&OP process that maintains exceptional supply chain operational performance over time.
SOP for MTS & MTO
For a MTS product group the difference bet’n a supply & demand results in a change of inventory. For a MTS product group the difference bet’n supply demand results in change in backlog.
Developing the MTS Sales & Operations Plan Report:
MTO plan will have a backlog plan instead of inventory plan.
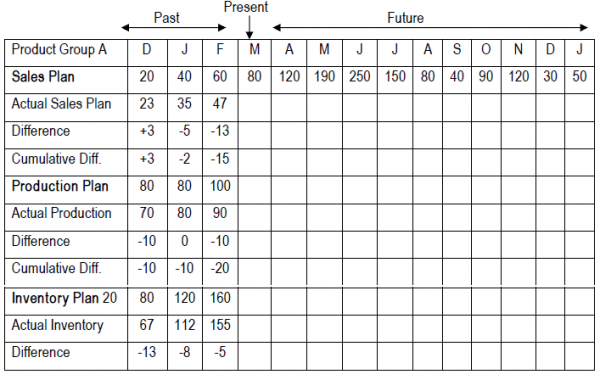
Sales Plan: Based on a combination of qualitative & quantitative forecasts. The cumulative is the running total difference from the beginning of the periods of historical comparison. This no. is useful in determining if there is a consistent trend associated with the forecast. A bias or consistent error will be apparent if the cumulative difference is +ve in most or all periods, or –ve in most or all periods.
Operations Plan:
In MTO SOP process generates Production Plan & MTS it also generates inventory plan. The 1st row displays the production plan. This is the projection of the anticipated supply volume by month for the product group. The 2nd row of operations plan displays the actual supply quantities that have been received for the product group within a particular month. This line shows actual receipts from production or from suppliers during the month. This row is used to compare with the production plan row. The difference line is difference bet’n production plan line & the actual supply line. The cumulative difference is the running total of the difference from the beginning of the historical comparison.
Inventory Plan:
The 1st row displays the plan; the projection of anticipated inventory level by month for the product group over the planning horizon. It is calculated in units & can be converted to financial terms to show the level of inventory investment. The 2bd row shows the actual inventory position for the product group at the end of a particular month. The difference line is the difference bet’n inventory plan line & the actual inventory line. There is no calculation of cumulative difference for inventory plan.
Setting Inventory Target Levels:
In a MTS management can set target inventory levels by product group in the sales & operations plan. These targets can reflect management objectives as max. or min. levels of inventory investment, planned inventory turn rates & days of coverage. It is the primary mechanism that management can use to predict levels of future inventory investments, inventory turns & days of supply.
Sales Plan:
Based on a combination of qualitative & quantitative forecasts. The cumulative is the running total difference from the beginning of the periods of historical comparison. This no. is useful in determining if there is a consistent trend associated with the forecast. A bias or consistent error will be apparent if the cumulative difference is +ve in most or all periods, or –ve in most or all
periods.
Operations Plan:
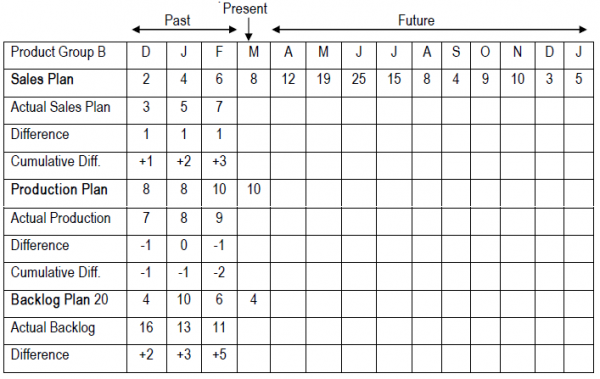
In MTO SOP process generates Production Plan & also generates backlog plan. The 1st row displays the production plan. This is the projection of the anticipated supply volume by month for the product group. The 2nd row of operations plan displays the actual supply quantities that have been received for the product group within a particular month. This line shows actual receipts from production or from suppliers during the month. This row is used to compare with the production plan row. The difference line is difference bet’n production plan line & the actual supply line. The cumulative difference is the running total of the difference from the beginning of the historical comparison. This no. is useful in determining if there is a bias or consistent –ve or +ve trend associated with the operations plan.
Backlog Plan:
The 1st row shows the anticipated backlog level by month for the product group over the planning horizon. It is a calculated field based on the sales plan, the supply plan & the opening backlog position. It is calculated in units & can be converted to financial terms to show the amount of order backlog. The 2nd row displays the actual backlog position for the product group at the end of the particular month. If the difference is shown as zero then it indicates that the sales & production are working together & the result is the balanced sales & operations plan. There is no cumulative difference for backlog plan.
Backlog VS. Back Order
Backlog is “all the customer orders received but not yet shipped. Sometimes referred to as open orders or the order board”. This includes all orders scheduled for future shipment. A high level of order backlog can imply that the product is in short supply, lead time can become lengthy * customers must wait for their products. The higher the level of backlog or the more vulnerable a company may be a competitor’s delivering products with lower lead time & hence to losing potential customer sales. Backlog include backorders. A backlog has a future delivery date.
Backorder is “an unfilled customer order or commitment. A backorder is an immediate (or past due) demand against an item whose inventory is insufficient to satisfy the demand”. This may indicate that the supplier has missed a customer requested delivery date. There are many other reasons for a back order. Regardless of the reason all backorders have become past due demands & there is an impact on the customer service & company reputation. From a planning point of view all backorders must be rescheduled in order to ensure that due dates are kept in the planning system. Backorders do not include all backlog.
Setting Backlog Target Levels
Management can set target backlog levels by product group in the sales & operations plans such as: max
backlog, min. backlog, planned order times, max customer waiting time. There are several strategies for
planning supply in response to varying demand such as level loading, chase & combination (or
compromise) strategies.