Seasonality
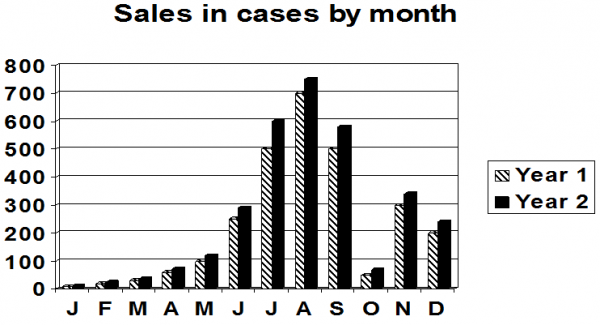
Many products have a seasonal or periodic demand pattern: skis, lawnmowers, bathing suits, and Christmas tree lights are examples. Less obvious are products whose demand varies by the time of day, week, or month. Examples of these might be electric power usage during the day or grocery shopping during the week. Power usage peaks between 4 and 7 p.m., and supermarkets are most busy toward the end of the week or before certain holidays.
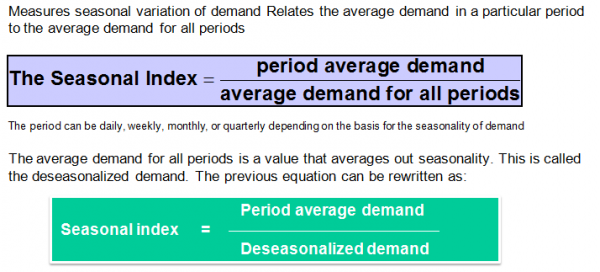
A useful indication of the degree of seasonal variation for a product is the seasonal index. This index is an estimate of how much the demand during the season will be above or below the average demand for the product. For example, swimsuit demand might average 100 per month, but in July the average is 175 and in September, 35. The index for July demand would be 1.75 and for September, 0.35.
Example: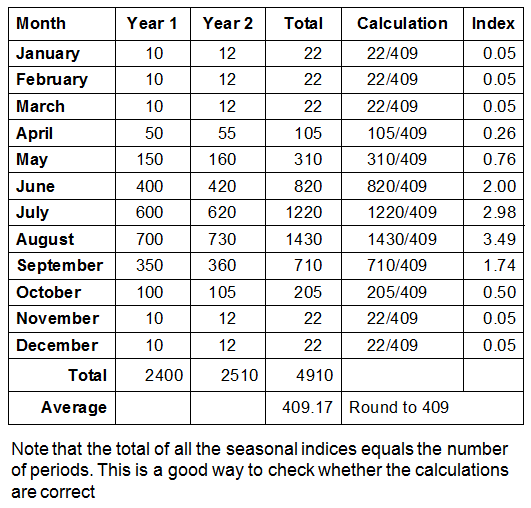
Seasonal Forecasts
The equation for developing seasonal indices is also used to forecast seasonal demand. If a company forecasts average demand for all periods, the seasonal indices can be used to calculate the seasonal forecasts. Changing the equation around we get:
Seasonal demand = (seasonal index)*(deseasonalized demand)
Usage of seasonal Index
1.Calculate the seasonal index from past years(year 1 & 2)
2.Forecast the demand for Year 3 using some quantitative method – moving average/exponential factor
3.Calculate the average demand for year 3 (Total demand in point 2/no of months)
4.Use the seasonal index to find out the demand for each month in year 3 (Amount in point 3* Seasonal index for the month)
Example: A company forecasts an annual demand of 420 units for next year.Calculate the forecast for quarterly sales if the seasonal Index for the first three quarters are 1.28,1.02 & 0.75 respectively.
Ans:
Forecast average quarterly demand = 420/4 = 105 units
seasonal Index for 4th quarter = 4 - (1.28 + 1.02 + 0.75) =0.95
Expected quarter demand = (seasonal index) (forecast quarterly demand)
Expected first-quarter demand = 1.28 x 105 = 134.4 units
Expected second-quarter demand = 1.02 x 105 = 107.1 units
Expected third-quarter demand = 0.75 x 105 = 78.75 units
Expected fourth-quarter demand = 0.95 x 105 = 99.75 units
Total forecast demand = 420 units
Deseasonalized Demand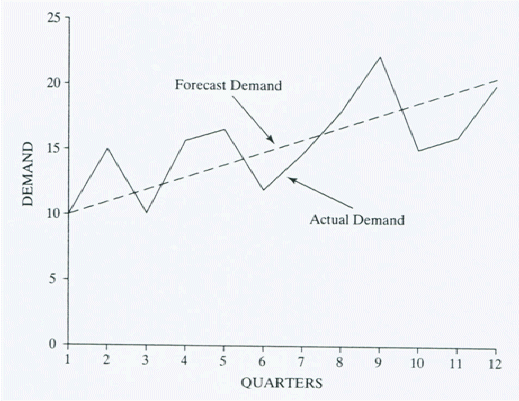
Forecasts do not consider random variation. They are made for average demand, and seasonal demand is calculated from the average using seasonal indices.Below fig shows both actual demand and forecast average demand. The forecast average demand is also the deseasonalized demand. Historical data are of actual seasonal demand, and they must be deseasonalized before they can be used to develop a forecast of average demand.
Also, if comparisons are made between sales in different periods, they are meaningless unless deseasonalized data are used. For example, a company selling tennis rackets finds demand is usually largest in the summer. However, some people play indoor tennis, so there is demand in the winter months as well. If demand in January was 5200 units and in June was 24,000 units, how could January demand be compared to June demand to see which was the better demand month? If there is seasonality, comparison of actual demand would be meaningless. Deseasonalized data are needed to make a comparison.
The equation to calculate deseasonalized demand is derived from the previous seasonal equation and is as follows:
Deseasonalized demand = (actual seasonal demand)/(Seasonal index)
Example
A company selling tennis rackets has a January demand of 5200 units and a July demand of 24,000 units. If the seasonal indices for January were 0.5 and for June were 2.5, calculate the deseasonalized January and July demand. How do the two months compare?
Answer :
Deseasonalized January demand = 5200/0.5=10,400 units
Deseasonalized June demand = 24,000/2.5=9600 units
June and January demand can now be compared. On a deseasonalized basis, January demand is greater than June demand.
Deseasonalized data must be used for forecasting. Forecasts are made for average demand, and the forecast for seasonal demand is calculated from the average demand using the appropriate season index.
The rules for forecasting with seasonality are:
Only use deseasonalized data to forecast.
Forecast deseasonalized demand, not seasonal demand.
Calculate the seasonal forecast by applying the seasonal index to the base forecast.