Data Collection and Forecast Techniques
Forecasts are usually based on historical data manipulated in some way using either judgment or a statistical technique. Thus, the forecast is only as good as the data on which it is based. To get good data, three principles of data collection are important.
1. Record data in the same terms as needed for the forecast. This is a problem in determining the purpose of the forecast and what is to be forecast. There are three dimensions to this:
- If the purpose is to forecast demand on production, data based on demand, not shipments, are needed. Shipments show when goods were shipped and not necessarily when the customer wanted them. Thus shipments do not necessarily give a true indication of demand.
- The forecast period, in weeks, months, or quarters, should be the same as the schedule period. If schedules are weekly, the forecast should be for the same time interval.
- The items forecast should be the same as those controlled by manufacturing. For example, if there are a variety of options that can be supplied with a particular product, the demand for the product and for each option should be forecast.
Suppose a firm makes a bicycle that comes in three frame sizes, three possible wheel sizes, a 3-, 5-. or 10-speed gear changer, and with or without deluxe trim. In all, there are 54 (3 x 3 x 3 x 2) individual end items sold. If each were forecast, there would be 54 forecasts to make. A better approach is to forecast (a) total demand and (b) the percentage of the total that requires each frame size, wheel size, and so on. That way there need be only 12 forecasts (three frames, three wheels, five gears, and the bike itself).
In this example, the lead time to make the components would be relatively long in comparison to the lead time to assemble a bike. Manufacturing can make the components according to component forecast and can then assemble bikes according to customer orders. This would be ideal for situations where final assembly schedules are used.
2. Record the circumstances relating to the data. Demand is influenced by particular events, and these should be recorded along with the demand data. For instance, artificial bumps in demand can be caused by sales promotions, price changes, changes in the weather, or a strike at a competitor’s factory. It is vital that these factors be related to the demand history so they may be included or removed for future conditions.
3. Record the demand separately for different customer groups. Many firms distribute their goods through different channels of distribution, each having its own demand characteristics. For example, a firm may sell to a number of wholesalers that order relatively small quantities regularly and also sell to a major retailer that buys a large lot twice a year. Forecasts of average demand would be meaningless, and each set of demands should be forecast separately.
Forecast Techniques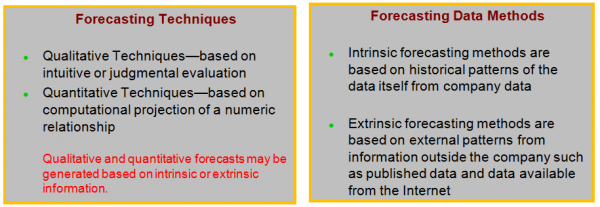
Qualitative Techniques
Qualitative techniques are projections based on judgment, intuition, and informed opinions. By their nature, they are subjective. Such techniques are used to forecast genera! business trends and the potential demand for large families of products over an extended period of time. As such, they are used mainly by senior management. Production and inventory forecasting is usually concerned with the demand for particular end items, and qualitative techniques are seldom appropriate.
When attempting to forecast the demand for a new product, there is no history on which to base a forecast. In these cases, the techniques of market research and historical analogy might be used. Market research is a systematic, formal, and conscious procedure for testing to determine customer opinion or intention. Historical analogy is based on a comparative analysis of the introduction and growth of similar products in the hope that the new product behaves in a similar fashion. Another method is to test-market a product.
There are several other methods of qualitative forecasting. One, called the Delphi method, uses a panel of experts to give their opinion on what is likely to happen. Few Qualitative techniques are given below
1. delphi method: forecast is developed by a panel of experts who anonymously answer a series of questions; responses are fed back to panel members who then may change their original responses
- very time consuming and expensive
- new groupware makes this process much more feasible
2. market research: panels, questionnaires, test markets, surveys, etc.
3. product life-cycle analogy: forecasts based on life-cycles of similar products, services, or processes
4. expert judgement by management, sales force, or other knowledgeable persons
Quantitive Techniques
Quantitative forecasting methods represent the relationship demand and one or more independent variables. Using quantitative forecasting is more objective than using qualitative forecasting.
Whenever you are going to conduct a quantitative forecast, you will need to collect the historical data which is relevant to your study in order to predict future conditions. This data should be checked for anomalies by plotting it and looking for outliers. If an anomaly is identified, it should be documented and removed from the dataset.
Quantitative forecasting can be categorized into two types of models. The first type, causal models, uses independent variables instead of (or as well as) time in order to generate a forecast. The second type, time series models, creates a demand profile with time as the independent variable.
Moving average
Exponential smoothing
Regression analysis
Adaptive smoothing
Graphical methods
Econometric modeling
Life-cycle modeling
Extrinsic Techniques
Extrinsic forecasting techniques are projections based on external (extrinsic) indicators which relate to the demand for a company’s products. Examples of such data would be housing starts, birth rates, and disposable income. The theory is that the demand for a product group is directly proportional, or correlates, to activity in another field. Examples of correlation are:
Sales of bricks are proportional to housing starts.
Sales of automobile tires are proportional to gasoline consumption.
Housing starts and gasoline consumption are called economic indicators. They describe economic conditions prevailing during a given time period. Some commonly used economic indicators are construction contract awards, automobile production, farm income, steel production, and gross national income. Data of this kind are compiled and published by various government departments, financial papers and magazines, trade associations, and banks.
The problem is to find an indicator that correlates with demand and one that preferably leads demand, that is, one that occurs before the demand does. For example, the number of construction contracts awarded in one period may determine the building material sold in the next period. When it is not possible to find a leading indicator, it may be possible to use a nonleading indicator for which the government or an organization forecasts. In a sense, it is basing a forecast on a forecast.
Extrinsic forecasting is most useful in forecasting the total demand for a firm’s products or the demand for families of products. As such, it is used most often in business and production planning rather than the forecasting of individual end items.
Intrinsic Techniques
Intrinsic forecasting techniques use historical data to forecast. These data are usually recorded in the company and are readily available. Intrinsic forecasting techniques are based on the assumption that what happened in the past will happen in the future. This assumption has been likened to driving a car by looking out the rear-view mirror. While there is some obvious truth to this, it is also true that lacking any other “crystal ball,” the best guide to the future is what has happened in the past.
Since intrinsic techniques are so important, the next section will discuss some of the more important techniques. They are often used as input to master production scheduling where end-item forecasts are needed for the planning horizon of the plan