Forecast Error & Tracking
Monitoring forecast feedback & measuring forecast performance are parts of the forecasting process. Monitoring forecast feedback alerts the forecaster to processes that are out of control & how far they are out of control. In the concept of tracking signals a demand filter identifies errors that exceed some predetermined range or trip value. Demand filtering checks actual demand against some limit & refers the data to a person to determine whether or not action should be taken. Whichever tracking signal is used the system will generate an exception report to alert someone that there is a forecast error. It is important to know why error has occurred. The most essential element in tracking the forecast is to hold people accountable for forecast accuracy.
Forecast Accuracy:
The avg. difference between the forecast value & the actual value. The difference bet’n the actual demand
& the forecast demand.
Forecast Accuracy = (Actual - Forecast) / Forecast
The forecast accuracy should be based on the forecast frozen at a period equal to the supply lead time.
Forecast Error:
Forecast error is the difference between actual demand and forecast demand. Error can occur in 2 ways: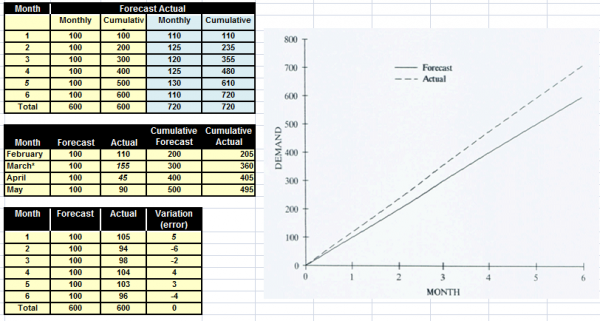
Bias:
“A consistent deviation from the mean in one direction (high or low). A normal property of a good forecast is that it is not biased”.
In terms of forecasting bias is the tendency of the forecast to be either above or below the actual observations. With this concept if the computed bias is –ve the forecast is consistently too low; if the computed bias is –ve the forecast is consistently too high. The +ve & -ve errors
cancel each other out when the bias is computed. Bias is a measure of general tendency or direction of error. Bias is calculated as the total error divided by the no. of periods.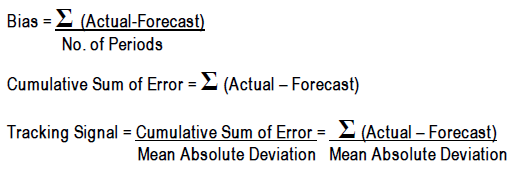
Bais exists when the cumulative actual demand varies from the cumulative forecast. This means the forecast average demand has been wrong. The forecast should be changed to improve its accuracy.
The purpose of tracking the forecast is to be able to react to forecast error by planning around it or by reducing it. Often there are exceptional onetime reasons for error. These reasons relate to the discussion on collection and preparation of data and the need to record the circumstances relating to the data;
Cumulative actual demand may not be the same as forecast. Consider the data in the Figure. Actual demand varies from forecast, and over the six-month period, cumulative demand is 120 units greater than expected.
Bias exists when the cumulative actual demand varies from the cumulative forecast. This means the forecast average demand has been wrong. In the example in the Figure, the forecast average demand was 100, but the actual average demand was 720 ± 6 = 120 units. The figure shows a graph of cumulative forecast and actual demand.
Bias is a systematic error in which the actual demand is consistently above or below the forecast demand. When bias exists, the forecast should be changed to improve its accuracy.
Errors can also occur because of timing. For example, an early or late winter will affect the timing of demand for snow shovels although the cumulative demand will be the same.
Tracking cumulative demand will confirm timing errors or exceptional one-time events. The following example illustrates this. Note that in April the cumulative demand is back in a normal range
Random variation: In a given period, actual demand will vary about the average demand. The difference are random variations.
The variability will depend upon the demand pattern of the product. Some products will have a stable demand, and the variation will not be large. Others will be unstable and will have a large variation.
Mean Absolute Deviation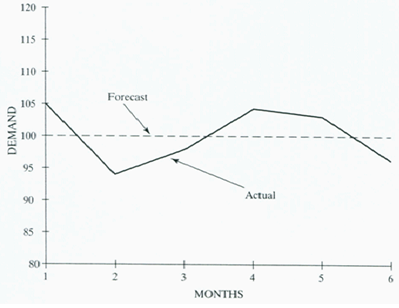
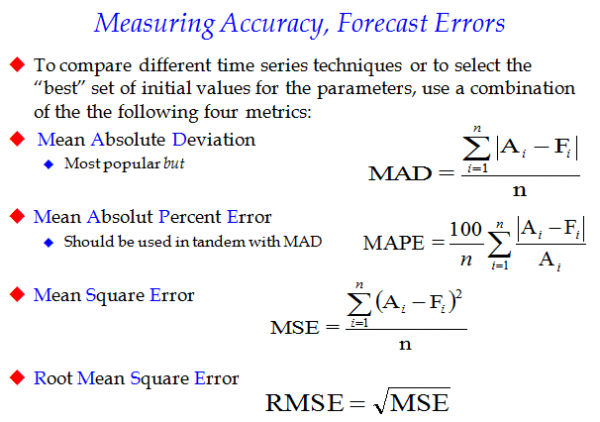
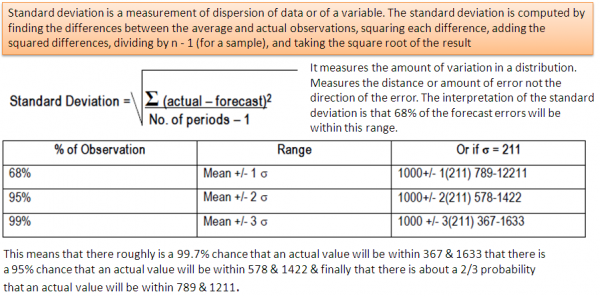
Forecast error must be measured before it can be used to revise the forecast or to help in planning. There are several ways to measure error, but one commonly used is mean absolute deviation (MAD).
Consider the data on variability in the side figure. Although the total error (variation) is zero, there is still considerable variation each month.
Total error would be useless to measure the variation.
One way to measure the variability is to calculate the total error ignoring the plus and minus signs and take the average.
This is called mean absolute deviation:
mean implies an average,
absolute means without reference to plus and minus,
deviation refers to the error
Normal distribution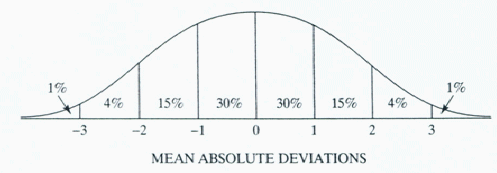 The mean absolute deviation measures the difference (error) between actual demand and forecast. Usually, actual demand is close to the forecast but sometimes is not. A graph of the number of times (frequency) actual demand is of a particular value produces a bell-shaped curve. This distribution is called a normal distribution and is shown in the site figure.
There are two important characteristics to normal curves: the central tendency, or average, and the dispersion, or spread, of the distribution. In the site figure, the central tendency is the forecast. The dispersion, the fatness or thinness of the normal curve, is measured by the standard deviation. The greater the dispersion, the larger the standard deviation. The mean absolute deviation is an approximation of the standard deviation and is used because it is easy to calculate and apply.
The mean absolute deviation is an approximation of the standard deviation and is used because it is easy to calculate and apply.
From statistics we know that the error will be within:
- ± 1 MAD of the average about 60% of the time,
- ± 2 MAD of the average about 90% of the time,
- ± 3 MAD of the average about 98% of the time.
Tracking Signal
The Tracking Signal or TS is a measure that indicates whether the forecast average is keeping pace with any genuine upward or downward changes in demand. Depending on the number of MAD’s selected, the TS can be used like a quality control chart indicating when the model is generating too much error in its forecasts.
Bias exists when cumulative actual demand varies from forecast. The problem is in guessing whether the variance is due to random variation or bias. If the variation is due to random variation, the error will correct itself, and nothing should be done to adjust the forecast. However, if the error is due to bias, the forecast should be corrected. Using the mean absolute deviation, we can make some judgment about the reasonableness of the error. Under normal circumstances, the actual period demand will be within ± 3 MAD of the average 98% of the time. If actual period demand varies from the forecast by more than 3 MAD, we can be about 98% sure that the forecast is in error.
A tracking signal can be used to monitor the quality of the forecast. There are several procedures used, but one of the simpler is based on a comparison of the cumulative sum of the forecast errors to the mean absolute deviation.
The TS formula is: (algebraic sum of forecast errors)/MAD
“The ratio of the cumulative algebraic sum of the deviations between the forecasts and the actual values to the mean absolute deviation. Used to signal when the validity of the forecasting model might be in doubt”.
Tracking signals are used to measure forecast bias & are computed by dividing the cumulative sum of the errors by the MAD. Bias will be shown if the results were consistently –ve or +ve. The calculation result should stay close to zero & should vary bet’n being –ve & +ve. A value called a trip value is the predetermined threshold at which an action message is generated, indicating potential forecast bias. One commonly used value is 4 in either direction. The absolute value of the tracking signal can be used as the alpha factor in exponential smoothing. This is called adaptive smoothing because the value of the alpha factors adapts to the forecast accuracy